
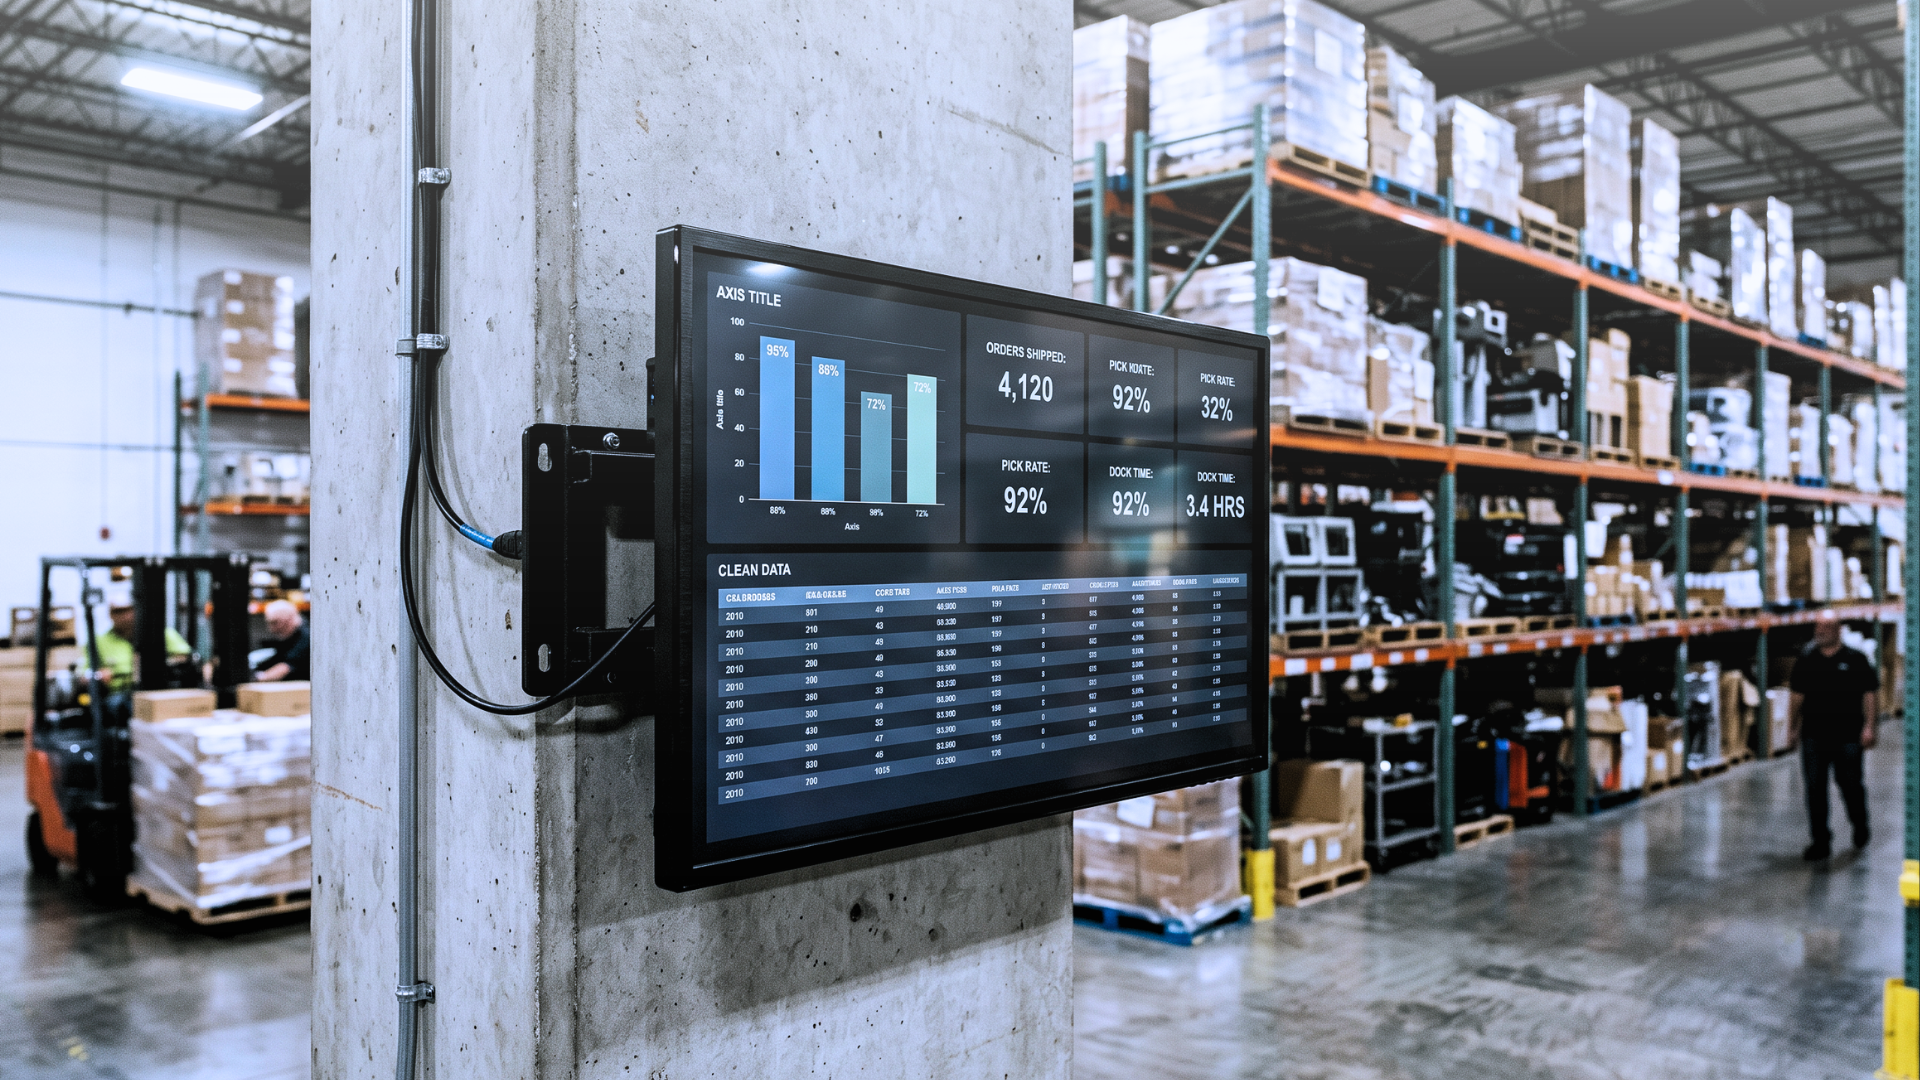
A logistics company runs 34 warehouse locations across three countries. Every Monday morning, someone on each local team opens a shared folder, downloads the updated KPI slide deck, connects a USB drive, and walks to each screen to update it manually. When a target changes mid-week, the process repeats. When someone forgets, the screens show last week's numbers. Decisions get made on stale data.
This isn't a technology problem. It's a workflow problem disguised as one, and it's far more common than most operations managers would admit.
What "Static" Digital Signage Actually Costs
The phrase "static digital signage" sounds like a contradiction. Screens are digital. But if the content on them requires a human to update it every time something changes, the medium is static regardless of the hardware.
The real cost isn't the screen or the license. It's the accumulated time behind every manual edit: someone downloading a file, redesigning a slide, uploading it, checking it on-site, repeating it across locations. In multi-site organizations, that cost compounds fast. Data from signage deployments shows that operational teams can spend 30–50% more on content management than initially budgeted, once the recurring effort of keeping displays current is taken into account.
The second cost is accuracy. A screen showing yesterday's price, last month's target, or an expired promotion isn't neutral. It creates friction at the point of decision — whether that's a customer at a retail shelf, a technician reading a production KPI, or a patient checking a clinic wait time.
Why Digital Doesn't Automatically Mean Dynamic
Most organizations that deployed digital signage over the past decade did so by replacing printed posters with slideshows. The hardware changed. The logic didn't.
Content still originates in a design tool. Someone still exports it. Someone still schedules it. The screen is now a pixel-based poster rather than a paper one, but the update cycle is almost identical. When values change in the ERP, the CRM, or the spreadsheet that runs the business, those changes do not reach the screen automatically.
This is the gap that separates conventional digital signage software from genuinely dynamic digital signage. The distinction isn't about resolution or screen size — it's about whether the content is connected to the source of truth, or disconnected from it.
What Changes When Data Drives Your Signage Content
When a signage platform connects directly to live data sources, the update cycle disappears. The screen doesn't need to be told that a price changed, a target was revised, or a queue threshold was crossed. It reads the source and renders the current value.
In practice, this means connecting to the systems already running the business: an ERP for inventory or pricing, a CRM for customer-facing metrics, a calendar for room availability, a spreadsheet for shift schedules, a sensor for occupancy or temperature. The content on screen becomes a live view of operational reality, not a snapshot taken at the last edit.
For a retail chain, this means promotional pricing updates the moment the campaign goes live in the back-end system, across every location simultaneously. For a manufacturing floor, the production dashboard reflects current shift output without anyone touching a file. For a corporate lobby, the meeting room display shows real-time availability pulled directly from the calendar system.
Across deployments where this kind of data integration replaces manual content workflows, the reduction in manual editing effort is consistent and significant. Livesignage clients report an average 73% reduction in manual edits after connecting displays to live data sources. That figure reflects not just time saved, but a structural change in how content is managed — from a scheduled task to an automated process.
3 Digital Signage Integrations That Move the Needle
Not every data connection delivers the same impact. These three tend to produce the fastest, most visible operational return:
• ERP and inventory feeds. Pricing, stock levels, and promotional data flow straight from the ERP to the screen. No one exports a spreadsheet or redesigns a slide when a price list changes — the display simply reflects what's in the system, store by store, warehouse by warehouse.
• Calendar and room-booking systems. Meeting room panels and reception displays pull availability directly from Microsoft 365, Google Calendar, or a booking platform. The screen always matches the actual schedule, with zero manual scheduling of the content itself.
• Spreadsheets and KPI dashboards. Google Sheets or Excel files that already track shift output, sales targets, or safety metrics become live data sources instead of documents someone re-exports every Monday. Update the cell, and the screen updates with it.
The Livesignage data source engine supports connections to all three categories — plus social feeds and custom APIs — without requiring code or IT involvement for standard integrations.
Switching from Static to Dynamic Signage: What It Actually Takes
Organizations that have managed signage manually for years often underestimate the switching effort and overestimate the disruption. The typical objection is that existing content templates would need to be rebuilt. In most cases, the rebuild is a one-time effort measured in hours, not weeks — and the output is a template that requires no further manual updates unless the design changes.
The more substantive question is whether the operational model supports the shift. Data-driven signage requires that the relevant data sources are accessible and structured. In most mid-to-large organizations, they already are: the ERP exists, the CRM exists, the spreadsheet exists. The missing piece is the connection between those sources and the display layer.
This is exactly the scenario a demo with a Livesignage specialist is designed to map: which data sources are already in place, which displays would benefit most from live content, and what the integration path looks like in practice.
When the Manual Signage Model Breaks Down
There's a point in every growing organization where the manual signage model fails visibly. It usually happens when the number of locations, languages, or content variants exceeds what a small team can manage without errors. A promotion runs at the wrong price in one region. A KPI dashboard shows a target that was revised two weeks ago. A room display shows a meeting that ended an hour earlier.
These aren't edge cases. They're the predictable output of a system where humans are the synchronization layer between data and display. The fix isn't more careful humans — it's removing humans from the synchronization loop entirely, and letting the data do the work.
Dynamic digital signage isn't a feature upgrade over static screens. It's a different operational model — one where the display is always current because it has no choice, not because someone remembered to update it.
If you manage a network of screens and want to understand how much of your current update workload can be automated, book a demo with a Livesignage specialist.