
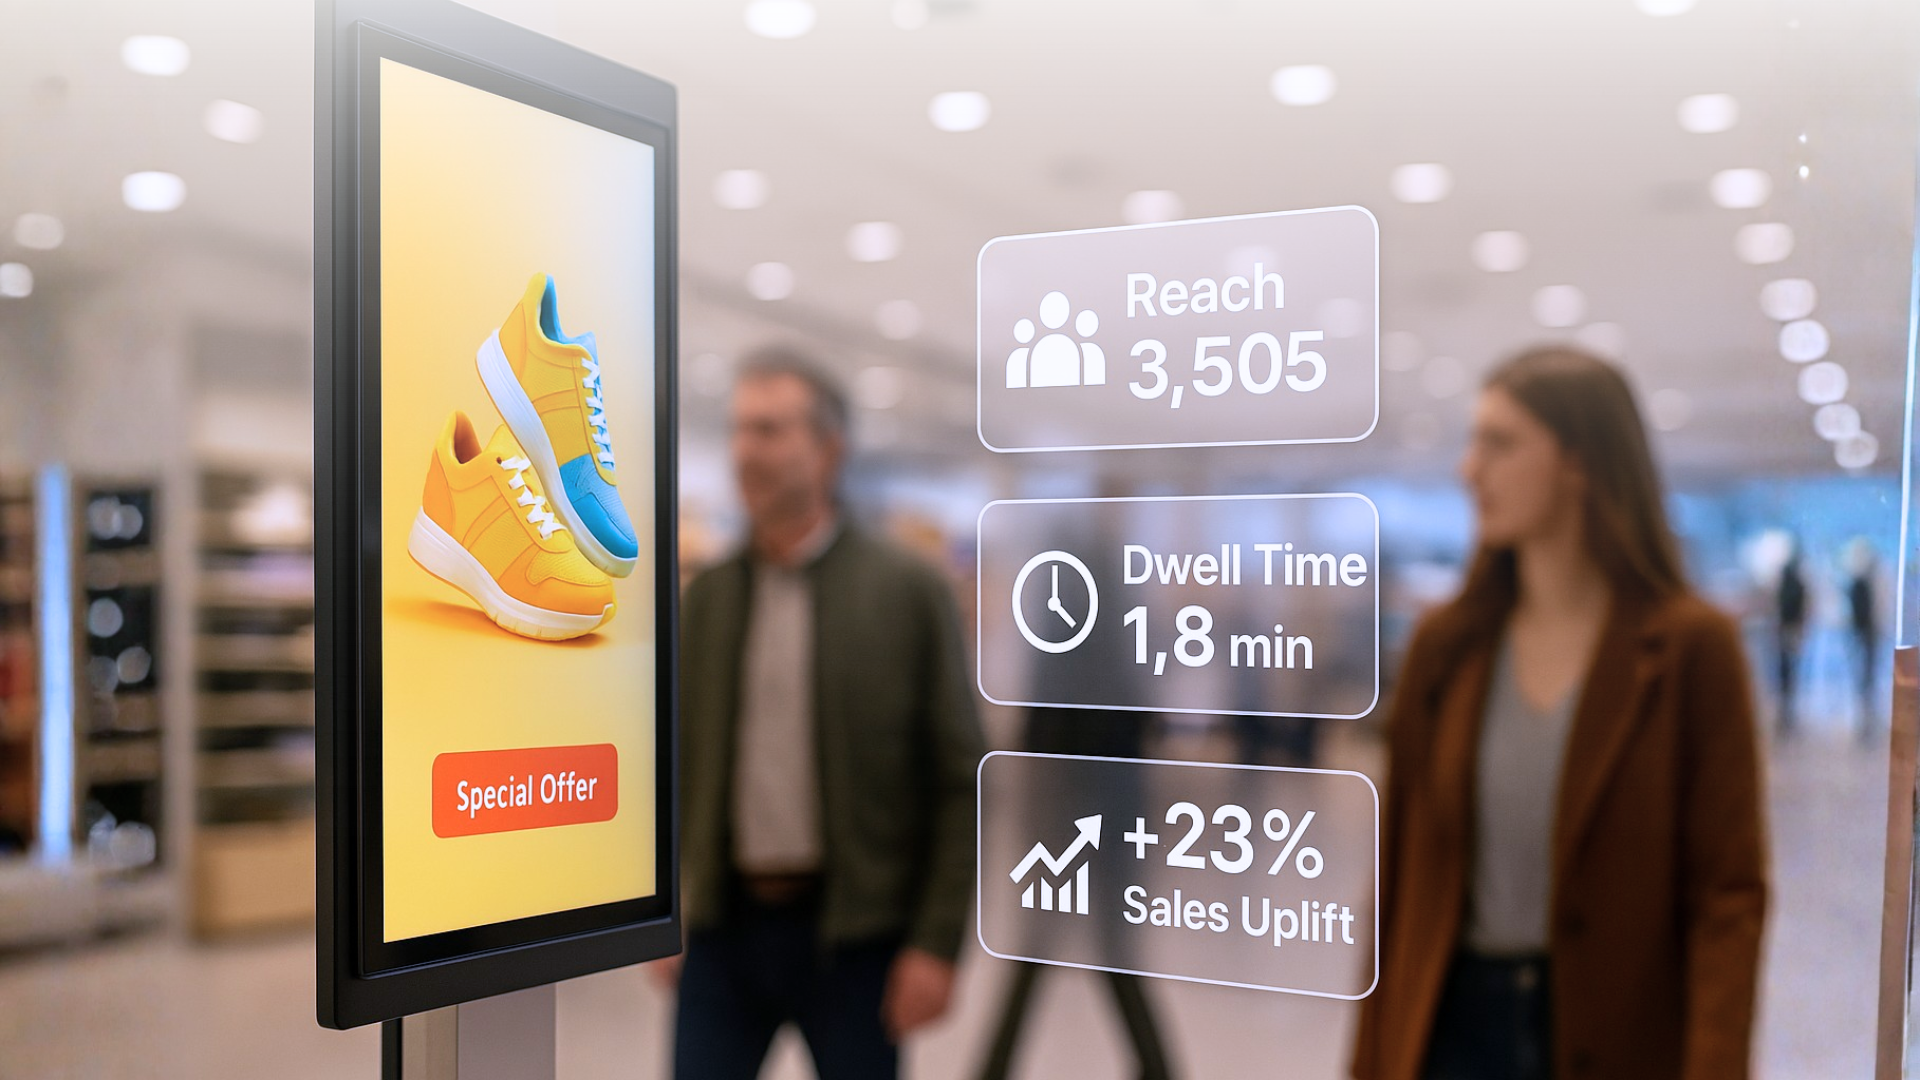
Many companies install digital screens hoping to attract customers’ attention and increase sales, yet only a few truly know whether those screens are delivering results. Today, the real Achilles’ heel of digital signage is not the technology itself, but the lack of clear metrics for measuring ROI. In this article, we explore how to transform screens from simple glowing posters into measurable marketing tools through the right KPIs and analytics strategies.
Why Measuring Digital Signage Performance Is So Challenging
Measuring the impact of digital displays isn’t as straightforward as tracking a website’s performance. There are no universal standards: every screen, location, and content type may require different metrics. In addition, physical environments such as retail stores, restaurants, and offices do not always make it easy to monitor how people behave around displays. This often leads to a dangerous assumption: “if people see it, it works.” But perceived engagement doesn’t always translate into real results.
To gain a realistic understanding of performance, businesses need digital signage KPIs that go beyond simple impression counts.
The Essential KPIs for Evaluating Screen Effectiveness
To understand whether content attracts attention, drives interaction, and supports business goals, several indicators can be considered:
- Visibility and reach: how many people looked at the screen, how long they watched, and how the display’s position affects the natural flow of visitors.
- Direct interactions: touchscreen activity, QR code scans, promotional-code activations, or actions triggered through connected platforms.
- Sales associated with promoted content: comparisons between promoted products or services and those not featured on screen.
- Exposure time and frequency: how often content appears and how long viewers remain engaged on average.
- Content-to-action conversion rate: the percentage of people who take a specific action after viewing content, such as purchasing a product or signing up for a service.
Data Matters Only with a Purpose: What to Measure in Each Industry
.png)
Not all screens serve the same purpose and should therefore not be measured using the same metrics.
- 🛍️ Retail: the focus is on in-store conversions: how many customers move into a specific area after viewing content and how promoted products perform compared with non-promoted ones.
- 🍽️ Restaurants and QSRs: digital menus and daily offers can be measured in terms of order uplift and the influence of featured items on customer choices.
- 🔔 Hotels, offices, and healthcare facilities: screens are intended to inform, reduce staff workload, and guide people through indoor spaces. Success may be reflected in smoother visitor flows and fewer requests for assistance.
- 🖼️ Museums and cultural venues: digital signage is often educational or experiential, so metrics may focus on dwell time, interactions, and visitor behaviour around installations.
Understanding the screen’s primary purpose — selling, informing, guiding, or engaging — allows you to select appropriate KPIs and turn raw data into meaningful insights.
Measuring everything is useless; measuring what matters is powerful.
How to Collect the Right Data in Practice
Today, several tools make it possible to track digital signage KPIs without complex setups. Privacy-conscious AI-powered sensors and camera analytics can estimate audience numbers, while POS or CRM integrations can help correlate specific content with sales. Unique promotional codes or QR codes assigned to individual pieces of content can make conversion tracking easier, while short surveys allow businesses to collect direct feedback. Together, these solutions can provide a more measurable picture of screen performance.
From Data to ROI: How to Calculate Return on Investment
Collecting data isn’t enough unless it leads to actionable insights. To understand the actual ROI of digital signage, KPIs must be connected to business outcomes. A simplified calculation compares the financial return attributed to the content with the overall investment in screens and campaigns.
Investment in displays: €5,000
Additional sales generated by content: €15,000
ROI = (Additional sales – Investment) / Investment × 100
ROI = (15,000 – 5,000) / 5,000 × 100 = 200%
In this simplified example, the calculated ROI is 200%, representing a net return of two euros for every euro invested.
Beyond the financial calculation, engagement metrics can help identify which content performs best and how to optimise future programming. Even conservative estimates offer valuable insights that justify new investments and strengthen the overall strategy, turning digital signage into a measurable, high-impact asset.
.png)
Monitoring the performance of digital displays is essential for demonstrating the value of digital signage. With clear KPIs and integrated analytics tools, each screen can become a measurable component that provides meaningful insights for marketing, sales, and operations.
Modern solutions, including those integrated into Livesignage, can simplify measurement and help businesses move from “blind communication” towards data-driven digital signage strategies.