
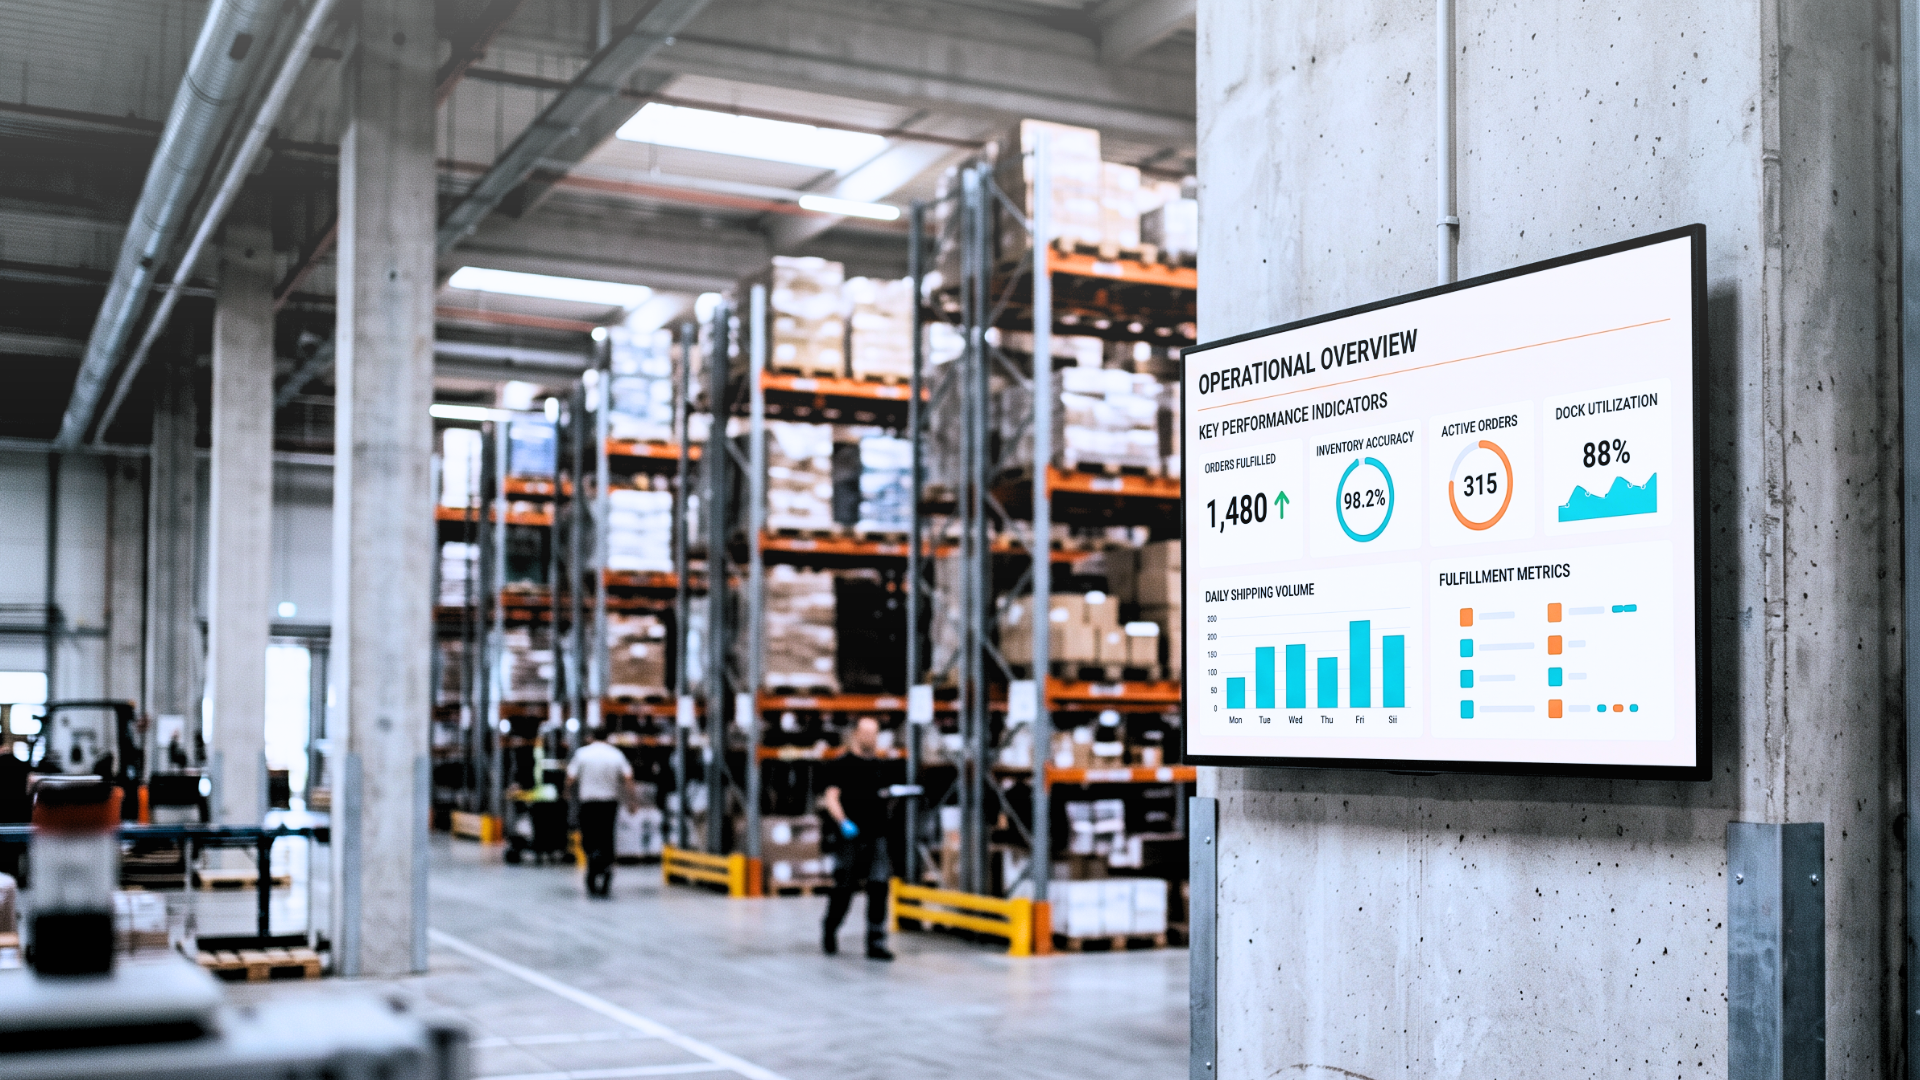
A manufacturing plant running three shifts discovers a quality defect at 2 AM. The line supervisor spots it on the floor display showing live rejection rates from the MES. By the time the morning shift starts, the issue is already logged, assigned, and tracked. No email chain. No delayed report. No meeting called to share what the screen had already shown. That is what a real-time dashboard display does when it is built into the operation, not bolted on as an afterthought.
Why Most Operations Dashboards Fail Before Lunch
The problem with most factory dashboards and KPI screens is not the screen. It is the data behind it.
Someone builds a dashboard in Excel or a BI tool, exports it as an image, uploads it to the signage CMS, and schedules it to display. Two days later, the figures are stale. A week later, nobody trusts what is on the screen. A month later, the display is showing a company logo and a motivational quote because maintaining the dashboard became too much work.
This pattern is common across industrial and corporate environments. The intent is right: give teams visibility into overall equipment effectiveness (OEE), cycle times, defect rates, throughput, or safety incidents. The execution breaks down at the update step, because the update is manual.
When the cost of keeping a screen accurate is measured in human hours, accuracy degrades. The screen becomes wallpaper.
What Changes When the Data Source Drives the Display
A real-time dashboard display that works is one where the screen is downstream of the data, not a copy of it.
The distinction matters operationally. When a display connects directly to the source — an ERP, a MES, a SCADA system, a SQL database, a spreadsheet updated by a shift supervisor — the display updates when the data updates. There is no export step, no upload step, no manual design revision every time a KPI threshold changes.
This is the architecture behind Live Control Room, the Livesignage application built for real-time operations dashboards. It pulls live data from the systems a plant or corporate operations team already uses, renders it on screen in a layout that matches the operational context, and updates continuously without human intervention.
The result is a display that operations managers can trust, because what it shows reflects what is actually happening on the floor or in the network right now.
The Manual Edit Problem in Multi-Site Environments
Single-site operations have a manageable version of the stale-data problem. Multi-site operations have a compounding one.
A corporate manufacturing group with twelve plants, each running its own KPI screens, faces a different challenge. When a group-level metric changes — a production target, a safety threshold, a compliance indicator — someone has to update twelve sets of displays. In practice, that means twelve different people, twelve different schedules, and twelve different chances for inconsistency.
Operations teams that have moved to Live Control Room report a 73% reduction in manual edits across their display networks. The mechanism is straightforward: when the data source changes, every screen connected to that source updates automatically. A revision to a group-wide KPI template propagates to all locations without anyone touching a file.
For a group operations director, this is not a minor convenience. It is the difference between a dashboard network that reflects reality and one that requires constant maintenance to stay relevant.
What Operations Dashboard Signage Looks Like in Practice
The use cases across industrial and corporate environments cluster around a few recurring patterns.
Production floors display OEE, units per hour, downtime events, and shift targets pulled directly from the MES or SCADA layer. When a line falls below a threshold, the display can trigger an alert state — a color change, a priority zone, a notification — without a supervisor manually flagging it.
Logistics and warehouse operations show pick rates, order fulfillment status, and inbound/outbound volumes from the WMS. Shift-to-shift handovers become faster when the outgoing shift's performance is already on the screen when the incoming team walks in.
Corporate operations centers use control room displays to aggregate data from multiple systems — finance, supply chain, customer service, IT — into a single visual layer. The display becomes the operational heartbeat of the room, not a slideshow.
Safety and compliance dashboards track incident-free days, near-miss reports, and inspection status. These are the screens where accuracy has consequences beyond efficiency: a stale safety metric is not just inconvenient—it is a liability.
In each case, the value of the real-time dashboard display depends on one thing: the data feeding it must be live, and the display must update without human mediation.
When Factory Dashboards Need More Than a BI Export
Most organizations already have a BI tool, such as Power BI, Tableau, Grafana, or a custom reporting layer. The question operations teams ask is: why not display its output directly on a screen?
The answer is that a BI export displayed on a screen is a static image of a dynamic dataset. It captures the state of the data at the moment of export, not the state of the data now. For a weekly executive review, that is acceptable. For a production floor where conditions change every few minutes, it is not.
Live Control Room does not replace the BI layer. It connects to it — and to the systems beneath it — and renders the output live. The display reflects the current state of the data, not a snapshot of it. For environments where decisions are made on what the screen shows, the difference between a live feed and a cached image is operationally significant.
Livesignage, a three-time Digital Signage Awards winner (2024, 2025, and 2026), built Live Control Room specifically for this gap: the space between what BI tools produce and what operations teams need to see in real time, on the floor, without a laptop in hand.
Where to Start with Real-Time Operations Visibility
The most practical starting point is a single use case with a clear data source and a clear audience. One production line. One warehouse zone. One operations center. Pick the KPI that, if visible in real time, would change how a shift supervisor or team lead makes decisions in the next hour.
That single screen, connected to a live data source, produces more operational value than twelve screens showing cached exports. Once the model proves itself in one location, extending it across sites is a configuration exercise, not a rebuild.
If you manage an industrial or corporate operation and want to see how Live Control Room handles your specific data sources and display environment, you can book a demo with a Livesignage specialist.